
Quick answer: FAST channel economics come down to one number: how much you keep per hour someone watches. Multiply ad slots per hour by fill rate, effective CPM and your share of the inventory, and you get revenue per viewing hour (RPVH). Divide your monthly costs by RPVH and you know how many viewing hours you need to break even. Roku, Tubi, Pluto TV and Samsung TV Plus differ less in “who pays most” than in deal structure: who sells the ads, who carries the fill risk, and what data you get back.
Flicknexs builds white-label OTT and 24/7 FAST channel platforms for content owners, and this guide uses the same revenue-per-viewing-hour model our team applies when scoping ad-supported channels. New to FAST? Start with our practical guide to what FAST channels are, then come back for the numbers.
Key takeaways
- Most FAST channels lose money on viewing hours, not on CPM. Break-even is a time-spent problem.
- In our illustrative model, raising fill rate from 60% to 80% lifts RPVH by 33%, more than a $3 CPM increase (+25%) or a 10-point better revenue share (+14%).
- There are four common deal structures: inventory split, revenue share, license fee and minimum guarantee. Each moves risk to a different party.
- Roku documents a default 70/30 inventory split for ad-supported apps. Licensing deals with Tubi, Pluto TV or Samsung TV Plus are negotiated individually and are not published.
- Fox’s pending acquisition of Roku would put Tubi and The Roku Channel under one owner. Plan for concentration risk in US FAST distribution.
1. Stop asking which platform pays most
“Which FAST platform pays the best?” has no public answer, because the major services do not publish standard partner rates. The better question is: which deal structure fits my content, my ad-sales capability and my appetite for risk?
Almost every FAST distribution agreement falls into one of four structures.
| Deal structure | Who sells the ads | Who carries fill risk | Your upside | Typical fit |
|---|---|---|---|---|
| Inventory split | Both parties sell their share of slots | You, on your share | High if you can fill your slots | Publishers with ad sales or a strong SSP setup |
| Revenue share | Platform sells everything | Shared | Medium; depends on platform demand | Libraries without an ad-sales team |
| License fee | Platform | Platform | Capped at the fee | Owners who want predictable cash |
| Minimum guarantee + share | Platform | Mostly platform | Floor plus upside | Proven libraries with bargaining power |
Roku’s developer documentation is the clearest public example of the first model: by default, an ad-supported app controls 70% of its ad inventory and Roku controls 30%, with each side keeping the revenue from the inventory it sells (Roku video advertising docs). Notice what that means: a 70% share of inventory is only worth 70% of revenue if you fill your slots as well as Roku fills its own.
2. The revenue-per-viewing-hour (RPVH) model
If you need the ad mechanics first (SSAI, SCTE markers, ad formats), read how FAST channels make money through ads. This section is about what those ads are worth to you. Impressions-and-CPM math hides the variable that actually decides whether a channel survives: viewing time. RPVH puts it at the center.
RPVH = ad slots per viewing hour × fill rate × (effective CPM ÷ 1,000) × your share
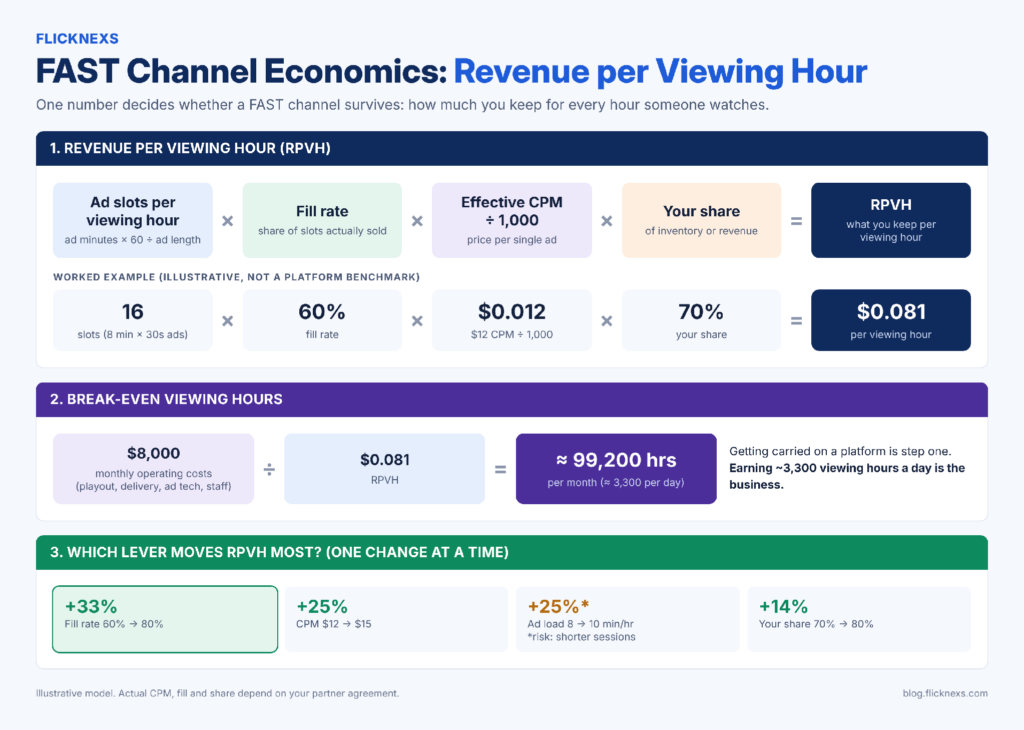
FAST channel economics: revenue per viewing hour formula and break-even viewing hours example
Ad slots per viewing hour = ad minutes per hour × 60 ÷ average ad length in seconds.
Worked example (illustrative, not a platform benchmark)
| Input | Value |
|---|---|
| Ad load | 8 minutes per hour |
| Average ad length | 30 seconds |
| Ad slots per viewing hour | 16 |
| Fill rate | 60% |
| Effective CPM | US$12 |
| Your share | 70% |
| RPVH | US$0.081 |
16 × 0.60 × 0.012 × 0.70 = US$0.0806 per viewing hour. Eight cents. That is the number every other decision hangs on.
Break-even viewing hours
Break-even viewing hours per month = monthly operating costs ÷ RPVH
With US$8,000 of monthly operating costs (playout, delivery, ad tech, staff time), the channel needs about 99,200 viewing hours a month, roughly 3,300 hours a day, just to cover operations. At an average session of 25 minutes, that is about 238,000 sessions a month.
This reframes the launch question. Getting carried on a platform is step one. Earning around 3,300 hours of daily viewing is the business.
Which lever moves RPVH most?
Changing one input at a time from the base case:
| Change | New RPVH | Change vs base |
|---|---|---|
| Base case | US$0.081 | n/a |
| Fill rate 60% → 80% | US$0.108 | +33% |
| CPM US$12 → US$15 | US$0.101 | +25% |
| Ad load 8 → 10 min/hour | US$0.101 | +25% (risk: shorter sessions) |
| Share 70% → 80% | US$0.092 | +14% |
Two lessons. First, fill rate is usually worth more operational attention than squeezing another few points out of the revenue share. Second, adding ad minutes looks as good as a CPM rise on paper, but if viewers leave earlier, RPVH rises while total viewing hours fall. Test ad load changes against session length, never in isolation.
Library yield: the content-cost check
Operating costs are only half the picture. Content has to pay for itself too, and the cleanest way to test it is library yield: viewing hours generated per hour of content per month.
Required library yield = (monthly content cost ÷ hours of content) ÷ RPVH
Example: 400 hours of licensed content at US$50 per hour per year costs about US$1,667 a month, or US$4.17 per content hour per month. At an RPVH of US$0.081, each hour in the library has to generate about 52 viewing hours a month to cover its license. Titles below that line are dragging the channel down; rotate them out or renegotiate.
3. Roku, Tubi, Pluto TV and Samsung TV Plus: what is verifiable and what you must ask
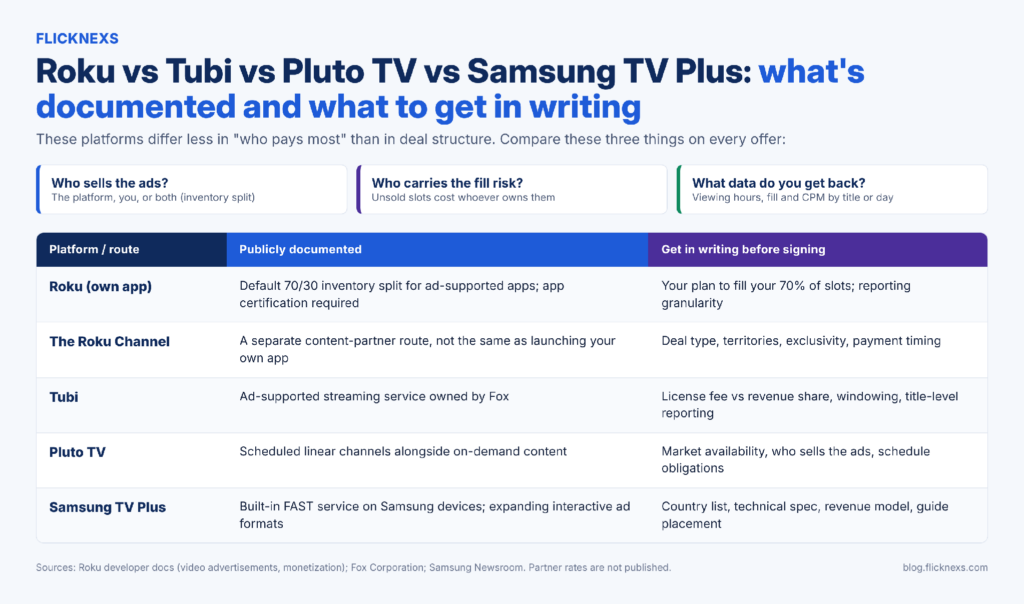
Roku vs Tubi vs Pluto TV vs Samsung TV Plus: what is documented vs what to get in writing
| Platform | What is publicly documented | What you must get in writing |
|---|---|---|
| Roku (own app) | Default 70/30 inventory split for ad-supported apps; certification required | Your fill strategy for 70% of slots; reporting granularity |
| The Roku Channel | Separate content-partner route from launching your own app | Deal type, territories, exclusivity, payment timing |
| Tubi | Ad-supported service owned by Fox | License vs share, windowing, title-level reporting |
| Pluto TV | Scheduled channels alongside on-demand content | Market availability, who sells ads, schedule obligations |
| Samsung TV Plus | Built-in FAST service on Samsung devices; expanding interactive ad formats | Country list, technical spec, revenue model, guide placement |
Roku: two different businesses under one brand
Building your own Roku app and getting your channel onto The Roku Channel are different deals. The app route gives you product control and the documented inventory split, but you own fill rate, certification and maintenance (Roku monetization docs). The Roku Channel route is a content-partner agreement with its own terms. Model them separately. For the app-side setup, see our guide on how to start a Roku channel.
Tubi: library licensing, not channel launching
Tubi suits film and series libraries that are hard to monetize on their own. Treat it as a licensing negotiation: the economics depend on title selection, territory, term and exclusivity, and those terms can block you from monetizing the same titles elsewhere.
Pluto TV: built for themed linear channels
Pluto TV’s channel-surfing experience rewards a tight programming concept with enough cleared hours to avoid visible repetition. Confirm market availability first; routes differ by country.
Samsung TV Plus: watch the ad formats, not just the reach
Samsung is pushing interactive and shoppable formats into Samsung TV Plus, including an Amazon Ads integration announced at IAB NewFronts 2026 that brings Amazon’s remote-enabled interactive video ads to the service (Samsung Newsroom). Richer formats can raise advertiser demand on the platform. They do not change your channel terms automatically, so ask how interactive inventory is shared and reported.
4. What the Fox–Roku deal means for FAST channel owners
On June 15, 2026, Fox announced a definitive agreement to acquire Roku for US$160 per share, valuing Roku at about US$22 billion in enterprise value. The deal combines Fox’s content, including Tubi, with Roku’s platform, The Roku Channel and its relationships with more than 100 million streaming households. Both companies said Roku would keep operating as an open, partner-friendly platform, and closing is expected in the first half of 2027 (Fox Corporation announcement; Advanced Television).
Until it closes, nothing changes contractually. But plan for three effects:
- Concentration risk. Two of the four platforms in this article could sit under one owner. A channel that depends on both has less diversification than it looks.
- Programming overlap. A content owner with sports or news may find Fox’s own programming competing for the same guide space.
- Renegotiation windows. Agreements signed now may come up for renewal after closing. Keep terms short or include change-of-control clauses where you can.
5. Own app, third-party distribution or hybrid: a numbers-first rule
Use RPVH to decide, not instinct.
- Third-party distribution first if you have no ad-sales capability and cannot buy viewing hours profitably. The platform supplies audience and demand; you accept a lower share.
- Your own [branded OTT app](https://flicknexs.com/create-ott-platform) if you can acquire viewers for less than RPVH × the viewing hours each viewer will generate, or if subscriptions and pay-per-view can lift revenue above ad-only RPVH.
- Hybrid if your rights allow it: distribute a FAST channel for reach and run your own branded app for premium windows, memberships and first-party data. Check exclusivity and windowing before promising any title to two places.
6. The FAST term-sheet scorecard
Score each partner offer line by line. Two numbers are involved, and they do different jobs:
- Score (0, 1 or 2) is how well this offer does on that line. You give it.
- Weight (1, 2 or 3) is how much that line matters to your economics. It is fixed.
Multiply score × weight for each line and add them up. The best possible total is 30 (a score of 2 on every line). A partner scoring 0 on either of the first two lines is a red flag regardless of brand or total.
| Question | Weight | 0 points | 1 point | 2 points |
|---|---|---|---|---|
| What is the deal structure (split, share, fee, MG)? | 3 | Verbal or unclear | Written, no worked example | Written, with a worked payment example |
| What reporting do I get? | 3 | Revenue total only | Monthly impressions and revenue | Viewing hours, impressions, fill and CPM by title or day |
| Who sells the ads, and can I bring demand? | 2 | Platform only, no visibility | Platform sells, shares CPM data | You can sell or plug in your own SSP |
| What exclusivity and territory limits apply? | 2 | Global exclusive | Exclusive in some territories | Non-exclusive or narrowly scoped |
| What are the technical and ad-marker specs? | 1 | Provided after signing | Partly documented | Fully documented before signing |
| How and when are payments made? | 2 | No stated schedule | Stated, but 90+ days after month end | Monthly or quarterly, with stated terms |
| Can terms change on a change of control? | 1 | Silent in contract | Notice period only | Notice period and exit right |
| What is the minimum programming commitment? | 1 | Beyond your cleared hours | Achievable with new licensing | Achievable with your current cleared hours |
How to read the total: 24–30 is a strong offer; 15–23 is negotiable, so push on the lowest-scoring high-weight lines first; under 15, walk away unless reach is the only goal.
Example: Partner A scores 2 on deal structure (2 × 3 = 6), 1 on reporting (1 × 3 = 3), 2 on ad sales (2 × 2 = 4), 1 on exclusivity (1 × 2 = 2), 2 on specs (2 × 1 = 2), 2 on payments (2 × 2 = 4), 0 on change of control (0 × 1 = 0) and 2 on programming (2 × 1 = 2). Total: 23 of 30. Negotiable, and reporting is the line to push.
7. A 90-day plan to launch a FAST channel
- Days 1–15: Prove the library. Audit cleared hours by territory and platform. Calculate required library yield for each title group.
- Days 16–30: Build the RPVH model. Run conservative, base and upside cases. Set the break-even viewing-hour target.
- Days 31–50: Shortlist and score partners. Use the Section 6 scorecard. Request written terms from at least two.
- Days 51–75: Technical build. Ingest, metadata, EPG schedule, SCTE or ad-marker setup, playback QA per partner spec. A cloud FAST channel platform with built-in SSAI covers playout, scheduling and ad insertion in one stack. For the full setup walkthrough, see how to launch a FAST channel in 2026.
- Days 76–90: Launch and instrument. Track viewing hours, session length, fill rate, effective CPM and RPVH weekly. Cut titles below the library-yield line after the first full month.
Build the economics before you pick the platform
FAST profitability is decided per viewing hour. Work out your RPVH, your break-even hours and your library yield first, then choose the Roku, Tubi, Pluto TV or Samsung TV Plus deal whose structure fits those numbers.
Ready to run the numbers on your own channel? Launch your FAST channel with Flicknexs: 24/7 cloud playout, EPG and server-side ad insertion, ready for Roku, Samsung TV Plus and other FAST distributors.
Related: How to get your FAST channel on Roku, Samsung TV Plus, Tubi and Prime Video.
FAQs: FAST channel economics
What are FAST channel economics?
FAST channel economics is the relationship between the advertising revenue a free ad-supported streaming channel earns and the cost of content, delivery, ad technology and distribution. The most useful single measure is revenue per viewing hour, because it links ad performance directly to how long people watch.
How do you calculate FAST channel revenue?
Multiply ad slots per viewing hour by fill rate, effective CPM divided by 1,000, and your inventory or revenue share. That gives revenue per viewing hour. Multiply by total monthly viewing hours for monthly revenue.
How many viewing hours does a FAST channel need to break even?
Divide monthly operating costs by your revenue per viewing hour. In our illustrative example, US$8,000 of monthly costs at US$0.081 per hour requires about 99,200 viewing hours a month.
What is a good fill rate for a FAST channel?
There is no universal benchmark; it varies by market, season and demand source. Track it weekly, because in our model a 20-point fill improvement raised revenue per viewing hour more than a US$3 CPM increase.
Does Roku take 30% of FAST channel ad revenue?
For ad-supported apps, Roku’s documentation describes a default split where the app controls 70% of ad inventory and Roku controls 30%. That is an inventory split, not a cut of your revenue, and content-partner deals with The Roku Channel can use different terms.
Do Tubi and Pluto TV pay a fixed revenue share?
Neither publishes a standard rate for content partners. Terms depend on the agreement, including deal type, territories, exclusivity and reporting, so get a worked payment example in writing.
Will the Fox–Roku deal affect FAST channel owners?
Nothing changes contractually until the deal closes, expected in the first half of 2027. Plan for concentration risk, since Tubi and The Roku Channel would share an owner, and consider change-of-control clauses in new agreements.
Is a FAST channel more profitable than a subscription OTT app?
In short: not by default. FAST earns cents per viewing hour; subscriptions earn per subscriber per month. Compare the two using the same viewing-hour assumptions, and consider a hybrid if your content rights allow it.